What does the data say about ANSPs’ resilience through the pandemic?
Introduction
The COVID-19 pandemic caused a collapse of traffic volumes due to state-imposed travel restrictions. Air traffic reached a low point in some regions of as much as 10 percent of 2019 volumes. This posed significant challenges for global aviation and ANSPs.
CANSO’s Global Benchmarking Workgroup has, for over a decade, collected data from ANSPs to measure performance. This article looks at 2020 data to examine how our providers were affected by the pandemic, how key performance metrics evolved and what that means for resiliency and ANSPs ability to mitigate the effect of similar challenges in the future.
Data presented in this article has been taken from ANSPs participating in the CANSO GBWG process, including participant surveys on how individual organisations have managed the pandemic. It is important to note that every ANSP has different reporting periods and responses to the pandemic. Although all regions broadly saw the same fall in global traffic in 2020, some areas like North America and Europe saw a faster and more pronounced rebound in demand towards the end of the year. The implementation and withdrawal of region-specific restrictions will also have a significant difference on local demand, so any analysis of data and ANSP resiliency should be considered in this context.
The pandemic’s impact on key performance indicators
The resilience of the ATM system and an assessment of how it performed during the pandemic is tied to many factors. The highest priority during crisis must be that the ATM system preserves safety and business continuity during times of uncertainty. On those measures all indicators are that the system did extremely well. Service interruptions were few and of short duration and were often the result of COVID-19 infection amongst ANSP operational staff. There were some small increases in accident rates per million flights[1] but the fatality risk in 2020 remained unchanged from the 5-year average.
There is also evidence that operational performance metrics affected by congestion improved in line with traffic decline, such as those associated with flight efficiency. This provided limited benefits for those aircraft operators still flying, such as reduced holding, more optimised routing and would have been experienced in reduced excess fuel burn.
While on these measures linked to ANSPs essential services role and the quality of service provided it is clear that the system performed well, it is also clear that other metrics show vulnerabilities to traffic shocks that need to be examined for lessons in future resilience. Financial resilience is a key factor that must be considered, particularly for long duration crisis such as the COVID-19 pandemic. An ability to quickly and easily scale operational costs while ensuring appropriate financial support allows for a flexible response to changing demand in either direction.
With a sudden and severe decline in traffic, it is not surprising that unit cost and productivity metrics were severely impacted. Average costs per IFR flight hour is a metric that cumulates ANSPs costs and spreads those out over the total number of annual IFR flight hours the ANSP handles in its airspace. The average cost per IFR flight hour among ANSPs participating in the GBWG benchmarking exercise over the past decade had trended downward, falling by 10 per cent from $491 USD per IFR flight hour in 2009 to $441 USD in 2019 in nominal terms. The cost efficiency improvement over the decade raises that to a 20 per cent decline in costs per IFR flight hour when the effects of inflation are considered.
In 2020, the decline in traffic caused the average cost per IFR flight hour to increase significantly to $860 USD. Some ANSPs saw even more significant 200-300% change in this metric, primarily due to high proportions of international traffic or complete local travel bans, while others, particularly those with strong domestic markets, were less affected.
It is important to note that while cost per IFR flight hour increased significantly, that does not mean that aircraft operators experienced those cost increases through pricing changes. The data show that service charges collected by ANSPs in 2020 covered only 65 per cent of ANSP costs. While in many cases the debt incurred will have to be recouped through future traffic, this provided valuable assistance during a financial crisis that was having significant impacts on air operators.
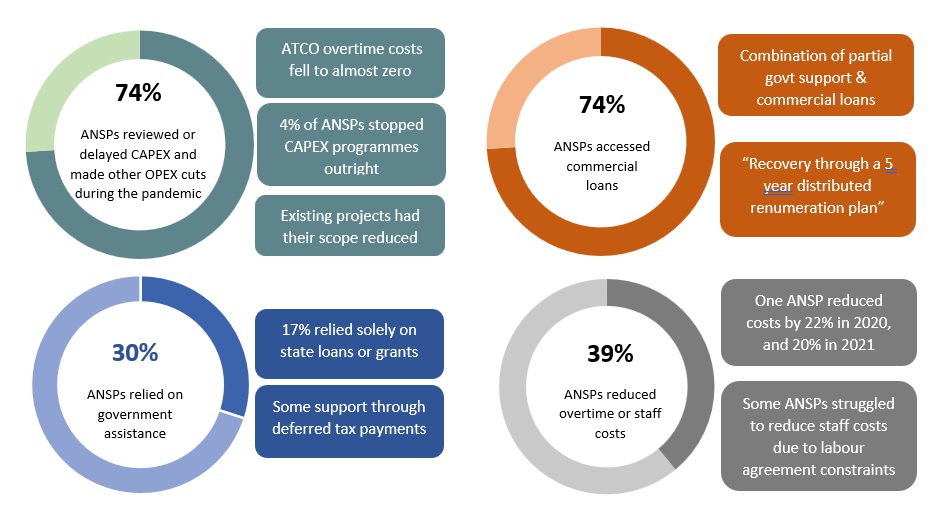
While ANSPs may not have had the same opportunity as others to reduce staffing levels because all airspace needed to remain open and all services needed to continue, average ATCO employment costs did fall, primarily due to a reduction in overtime hours that accompanied the fall in traffic. Average ATCO annual working hours fell by 10 per cent from 1506 to 1370, with a corresponding fall in average ATCO employment costs of eight per cent. But not surprisingly, there was a decline of 44 per cent in ATCO productivity as measured by IFR flight hours per ATCO in operations.
Mitigating the financial effect of the pandemic

The majority of submitting ANSPs took action to adjust their cost base in response to the downturn in traffic and revenue and sought financial support to help fill the revenue gap. However it is worth noting that average total costs have only decreased marginally when compared to 2019, despite there being a large variance between ANSPs.
A large majority, 74%, of ANSPs controlled expenditures through the review and postponement of existing CAPEX. While this may serve to reduce planned expenditures quickly in order to ensure continued operation during the pandemic, postponing future projects may delay much-needed capacity enhancements, which may cause difficulties should traffic rebound quickly to pre-pandemic levels. However, just 4% of ANSPs completely stopped their CAPEX programmes altogether, meaning there is likely awareness of the risks posed by doing so.
While there were operating cost reductions, these were not sufficient to match costs with significantly reduced revenues. Providers have managed to retain ATCOs while deploying them on other, more cost-effective duties, offsetting efficiency losses while keeping operational costs similar. ANSPs highlighted the high level of fixed costs and the challenges around ATCO retention and the training (to avoid capacity shortages as traffic recovers) as factors limiting the reduction to in operating costs.
Commercial loans were the predominant way for ANSPs to receive financial support to close the revenue/cost gap. Several ANSPs noted there was very limited scope for governments to provide capital injections, in part due to the competing financial demands on governments during the pandemic. Some ANSPs were able to access cash reserves or reduce financial pressure by deferring tax payments or other contributions for a period of time.
While increases in service charges have now occurred in many areas, very few occurred during 2020, with only 4% of respondents having adjusted charges. In fact many ANSPs gave service charge deferrals or fee holidays during the pandemic, while others kept charges stable while funding the deficit through commercial loans or state aid.
Future resilience of ANSPs

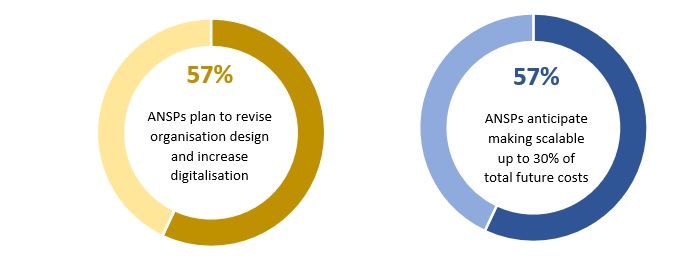
It is clear that the past two years are causing many in the aviation industry to examine the factors that drive their resilience. A majority of ANSPs have indicated they have active plans to adjust their organizational design, shift priorities and increase digitalisation. An equal majority have indicated that they are seeking to make a portion of their future costs more easily scalable with traffic. Some have indicated their intention to integrate scalability into supplier contracts.
These efforts to examine ways to strengthen the ATM industry’s ability to scale with traffic, even if only in part are worthwhile. Scalability is not symmetrical, and measures that enable ANSPs to scale with traffic growth, will not always provide benefits in the instance of traffic decline.
As ANSPs look to make changes to strengthen future resilience to similar shocks it’s important to take a balanced view of system performance during this crisis. On certain metrics the system performed well. The impact of measures to enhance scalability on all performance areas should be continually evaluated.
[1] https://www.iata.org/en/pressroom/pr/2021-03-25-01/


